

After having set up a basic data model and date table, now it is time to start analyzing the data by writing DAX measures. I will start by creating a new table to store the measures and then write the DAX formulas for Total Sales, Total Cost, Total Profits and Profit Margin.
1: Creating a table to store the DAX measures
After opening the DK Retailer .pbix file, I navigate to the Enter data button on the ribbon. This will open the Create Table window. I leave the column and row empty and under Name I type “Main Measures” and click on Load.

The table will appear in the Fields pane on the right of the canvas. It has an empty column and row.
2: Calculating Total Sales
Now it’s time for our first DAX measure. Let’s start by calculating Total sales/Revenue. In order to do that we need to first look at the Sales data and find out whether we have the necessary information to calculate Revenue. I go to the Data pane and select the Sales table from Fields.

As it can be seen above, the Sales table contains information for each transaction. Each transaction refers to one product and the corresponding quantity sold. However, there is no Sales Price in the Sales table. The Sales Price is saved in the Products table as can be seen below.
![_!roduct D
PD12000
PD12001
PD12002
PD1200s
PD12004
PD12005
PD1200s
PD12007
PD12008
PD1200g
PD12010
Product Name
Product I
Product 2
Product 3
Product 4
Product 5
Product 6
Product 7
Product 8
Product g
Product 10
Product Il
Product Description Original Sale Price •
Cost Current Price
Wine - Wyndham Estate Bin 777
The Pop Shoppe - Root Beer
Squid 05 - Thailand
Papa vas
Onions - Green
Onions - Dried, Chopped
Cornstarch
Truffe Shells - White Chocolate
Fuji Apples
Rice - Wild
Onions - Cooking
2241 kr
951 kr
847 kr
178S kr
1278 kr
684 kr
SIS kr
1812 kr
sog kr
561 kr
kr
208 kr
420 kr
Isos kr
2241 kr
951 kr
847 kr
178S kr
1278 kr
684 kr
SIS kr
1812 kr
VAT E]
560,25 kr
237,75 kr
211,75 kr
S19,s kr
78,75 kr
146 kr](https://giulio.dk/wp-content/uploads/2021/07/image-22.png)
One of the main caveats of Power BI and DAX is that all the measures refer to columns and rows and not individual cells as is the case with Excel. Even though the columns needed are in separate tables, through the power of the data model we can relate these columns by writing the appropriate DAX measures.
To calculate Total Sales, we need to use a so-called iterating function. It is called an iterating function because it evaluates each row in a table. I go ahead and click on the New measure button in the Calculations group on the ribbon.
There I type in the following DAX measure:
![Name
Measu re
S' Format
Data category Uncategorized
Fome table Vain Veasures
Structure
X 1 Total Sales
sumx( sales,
Sales [Quantity]
New Quick
measure measure
* RELATED( Products[Current Price) ) )](https://giulio.dk/wp-content/uploads/2021/07/image-16.png)
This measure takes the Quantity column in the Sales table and then it multiplies with the Current Price column in the related table Products. It goes through each row in the two tables and returns the aggregation we need, in this case a multiplication and then sums it all up at the end.
3 Calculating Total Costs
The process for calculating Total Costs is similar to the previous step. Again, I click on the New measure button and type in the following measure:
![Home
X cut
Copy
Paste
Format painter
Clipbærd
Insert Modeling
View Help
External Tools
Dataverse Recent
Table tools
Measure tools
Get Excel
data workbook
Power BI
datasets
SQL Enter
Server data
Transform
data
Refresh
New Text
visual box
More
visuals
New Quick
measure measure
Sensitivity
(preview) v
Sensitivity
Publish
X 1 Total Costs =
SIJMXQ Sales, Sales (Quantity]
* RELATED(
sources v
ProductsCCost] ) j](https://giulio.dk/wp-content/uploads/2021/07/image-21-1024x243.png)
4 Calculating Profit and Profit Margin
To calculate Profit we need to subtract the costs from the revenue and with DAX measures it is very easy to do so by referring to the already created measures. Again, I click on New measure and type in the following Total Sales followed by the minus sign and Total Costs. Notice how the color changes to purple.
![Name
Measu re
S' Format
: Tots-_ Sales:
Data category Uncategorized
Fome table Vain Veasures
Structure
X I Total Profits
Auto
Costs]
New Quick
measure measure](https://giulio.dk/wp-content/uploads/2021/07/image-15.png)
5 Formatting the measures
Before calculating the Profit Margin I want to show another way of writing a measure. First of all, we need to make sure that the three measures are in the Main Measures Table. In the Fields pane I can see that I have the three measures.

However, I want this table to be placed on top of the other tables to differentiate it. To do that, I first need to delete the Column 1 inside it. I right-click on Column 1 and click on Delete from model.

By doing so, the Main Measures table has now been sent to top. The icon also changed automatically to one with a calculator confirming that this is a table containing measures.

Now it’s time to format the measures and choose how many decimal places the numbers should have. I click on the measure and then under Measure tools, I choose Currency and two decimal places for all three measures.
![Home
Insert
Modeling
View
Help
External Tools
Table tools
Measure tools
Name
Total Sales
S' Format Currency
$ % 408
Data category Uncategorized
Home table Main Measures
Structure
New Qu ick
measure measure
X 1 Total Sales =
sumx( sales,
Sales [Quantity]
* RELATED( Products[Current Price) ) )](https://giulio.dk/wp-content/uploads/2021/07/image-20.png)
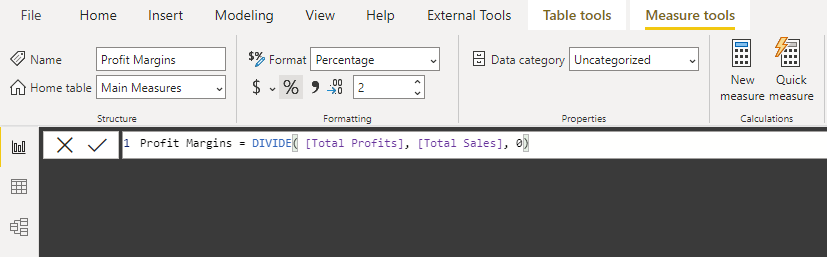
6 Write DAX from Table
Another way of writing a DAX measure is by right-clicking in one of the tables from the Fields pane. This means that the new measures will be automatically stored in that table. So, I go ahead and create the measure for Profit Margins. Here I use DIVIDE and add a 0 for Alternate Result. At the end I format this to a percentage with two decimal places.
7 Create a Table
Lastly, let’s put all these measures inside a table. From the Visualizations pane, I click on Table. In the Values I drag the measures one by one. The resulting table shows the Revenue, Costs, Profits and Profit Margins for all the data.

DAX Measures used in this video:
| Total Sales | SUMX( Sales, Sales[Quantity] * RELATED( Products[Current Price] ) ) |
| Total Costs | SUMX( Sales, Sales[Quantity] * RELATED( ‘Product'[Cost] ) ) |
| Total Profits | [Total Sales] – [Total Costs] |
| Profit Margins | DIVIDE( [Total Profits], [Total Sales], 0 ) |